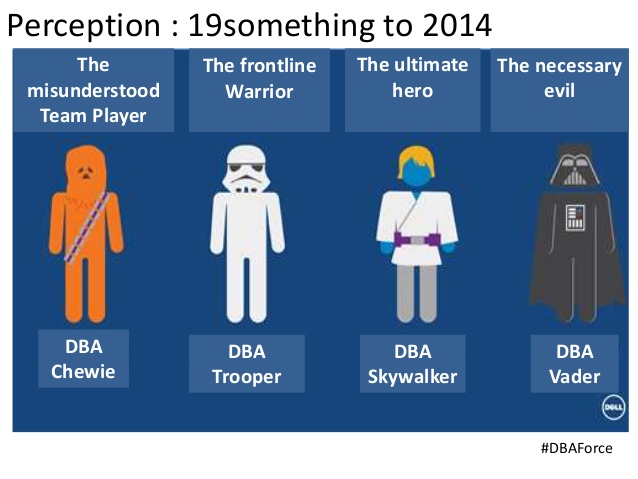
Being a cloud DBA

Database administration is a dying breed; don’t go there“; that was the advice I received twenty-one years ago. It is a popular idea that spring up from time to time. The latest argument came from the cloud: database services are well-automated so who needs a good DBA?

I have seen two main arguments for the diminishing role of the DBA which i have seen repeated in blogposts and first hand conversations.
First: new technology makes the DBA obsolete. The latest databases are self tuned, the administration is automated, relational databases will be taken over by NoSQL or Hadoop, MongoDB, XML, Object Oriented databases, Cloud.

This argument fades away as soon as that new technology falls from its hype cycle. NoSQL didn’t replace the RDBMS, administration tasks are more difficult in an ever increasing landscape, the cloud merely shifts the work to optimalisation, capacitymanagement and tasks higher in the value chain.

The second argument stems from an underestimation of the DBA work: “We don’t need DBA’s because our developers know enough about databases“. I have heard similar statements during job interviews. When I asked why a DBA role considered by this company I was told that “the developers don’t have time anymore for DBA work“. This was a softwarehouse where no one needed a DBA until they realised they NEEDED a DBA. A need for a firefighter role to fix the datamodel, performance or datacorruption. A need for a firefighter that would silently do his work without causing any delay in the software build process, bring about fundamental changes in the structure without using up other resources. There was no ambition to raise the maturity level of the buildprocess, no vision on operational intelligence or business intelligence: innovation was confined to application features. For efficiency and control over the buildprocess they used Scrum, that would suffice.

There is one funny in that job interview I would like to share with you. After hearing their situation, I asked them if they have a lot of incidents now and if they thought that was part of the deal of writing software. I forgot the exact answer they gave, but I didn’t forget that the IT manager interviewing me was called away ..… for an incident.
I concluded the interview without seeing him again.

To advocate or not?

SQLserver guru Brent Ozar had an encouter with a CTO who said “I thought I’d save money in the cloud by not having a DBA, but what I’m learning is that in the cloud, I actually get a return on my DBA investments.” Surely, for performance projects in the cloud, picking up the euro’s is visible for everyone. But streamlining and compacting a databaselandscape for better agility is reserved for good technical leadership who is aiming for a mature company. Central question for a company is: how do you see your DBA?

Plan Guides on SQL Server

A bulletproof implementation method

A Plan Guide is a way to add a hint to a SQL statement if you can’t change the SQL statement at the source. This performance trick is hidden deep into the performance toolbox and shouldn’t be the first weapon of choice. I found that implementing planguides a bit of a delicate excercise , both on Oracle and SQL server. A small and insignificant copy/paste error seems to leave the planguide inoperable. I therefor use the following methode for SQL server which consists of 5 steps:

(1) retrieve the SQL_handle from the cache
(2) retrieve the executionplan and store this in a planguide
(3) store the planguide in a file
(4) edit the executionplan in this file
(5) drop the old planguide and load the new one from the edited file.

So let’s have a look at those steps in turn:

(1) retrieve the SQL_handle from the cache

Update: I gave an SQL statement that assumed the same session. This one is better:

With SQLHandleview as
(
SELECT SUBSTRING(st.text, (qs.statement_start_offset/2)+1,
((CASE qs.statement_end_offset
WHEN -1 THEN DATALENGTH(st.text)
ELSE qs.statement_end_offset
END – qs.statement_start_offset)/2) + 1) AS statement_text,
qs.sql_handle
FROM sys.dm_exec_query_stats qs cross apply sys.dm_exec_sql_text(qs.sql_handle) st
)

select * from SQLHandleview
where
statement_text like ‘%delete from device_context where dev_varnam =%’

Of course, you should adjust the query to find the query you’re looking for in the Where clause.

(2) retrieve the executionplan and store this in a planguide

declare @plan_handle varbinary(64);
declare @offset int;
declare @plan_name nvarchar(128);

select @plan_handle = qs.plan_handle
, @offset = qs.statement_start_offset
, @plan_name = ‘pg_’ + convert( varchar(128), qs.sql_handle, 1 )
from sys.dm_exec_query_stats as qs
cross apply sys.dm_exec_sql_text(sql_handle) as st
cross apply sys.dm_exec_text_query_plan(qs.plan_handle, qs.statement_start_offset, qs.statement_end_offset) as qp
where qs.sql_handle = (0x02000000B9B415076207F052F2B4D7FB13AA4A5041C20CFC00000000000000000000000)
and qp.dbid = DB_ID();

execute sp_create_plan_guide_from_handle
@name = @plan_name,
@plan_handle = @plan_handle,
@statement_start_offset = @offset;

Insert your SQL_handle in the code.

(3) store the planguide in a file

Store the PlanGuide into a file

(4) edit the executionplan in this file

/****** Object:  PlanGuide pg_0x0200000066091D031E28B462D77B6F735FC1351A92C3A2C80    ******/

EXEC sp_create_plan_guide

@name = N'[pg_0x0200000066091D031E28B462D77B6F735FC1351A92C3A2C80000]’,

@stmt = N’select d.dwnld_seq, d.sys_id, d.dwnld_stat_cd from sl_dwnld d where d.dwnld_stat_cd =  @P0  and d.sys_id like  @P1  order by dwnld_seq’,

@type = N’SQL’,

@module_or_batch = N’select d.dwnld_seq, d.sys_id, d.dwnld_stat_cd from sl_dwnld d where d.dwnld_stat_cd =  @P0  and d.sys_id like  @P1  order by dwnld_seq’,

@params = N’@P0 nvarchar(4000),@P1 nvarchar(4000)’,

@hints = N’option ( optimize for ( @P0 = ”EC” ) )’

As you can see, I inserted an OPTIMISE FOR hint into the SQL text.

(5) drop the old planguide and load the new one from the edited file.

Script/File option

In order to activate the planguide you should drop the present plan from the cache:

DBCC FREEPROCCACHE (plan_handle_id_goes_here)

Review: SQLbits Manchester 2019

Who has never been to a SQLbits conference will be in for a little shock. Conference by name, but geekfest in appearance, this SQLbits is a special beast in the world of SQLserver conventions. Most eyecatching is “the infamous SQLbits party”, where this year there was a party around the theme of the roaring twenties; gambling, Al Capone, Charleston dancers and reliving the frolicks of a post-war period.

What is good about this conference is that there’s a lot of room for networking. As you may have noticed, IT-folks are better with computers than people, and a little more guidance in meeting people is helpful. For example: there are tables for every industry : banking, healthcare etc so you can team up with people in you branch. There was also a pubquiz where we were put in groups of about 6 people and had to answer freakish questions like “How tall was the brother in the lyrics of “I can’t stand losing you” from the Police?”. I’m embarrassed to admit that I knew the answer to that one.

The Man in MANchester

On to the technical sessions. It’s impossible to mention all 150 of them, but generally the quality of them was very good. I went to most of the Powershell sessions, as this is my focus this year. Rob Sewell showed us how to build a threshold monitoring with Pester – a wonderful idea – and connected it to PowerBI for management consumption.

Wonderfull conference, I hope to go next year as well

SQLSaturday NL #790

Right before the saturday, Microsoft announced the withdrawal of their support of SQLsaturdays. What would this mean for the next events? I couldn’t find an official statement from Microsoft to share, but the message came across: SQLserver isn’t hot anymore. The real bets are on different cards, such as Artificial Intelligence and Big data.

But nothing of this impending doom on that sunny saturday. We were offered 35 sessions on subjects ranging from Business Intelligence, Azure, AI & Machine learning, performance,  specific subjects such as “U-SQL custom extractor for multi-gigabyte XML” and reminders that we should learn about powershell ( “dbachecks – The PowerShell Module to validate your SQL Estate”) or Extended Events (“Simplifying XEvents Management with dbatools”) .

A new kid on this block is GDPR. Privacy is well valued in this new law, so far so good,but implementing this law is a complex task with unknown unkowns on the way. Even Brent Ozar freaked out and doesn’t sell his services to inhabitants of europe anymore. “GDPR, A European Horror Story” by John Martin gave a nice overview of the problems to follow. He urged us to follow the recent news about Apollo.io, a spamfactory sales engagement startup, whose breach this summer may lead to the first serious testcase of GDPR after Europeans found their data back via haveibeenpwned.com.


Book review: SQL Query store in Action

SQL Query store in Action
A deep dive into the details on the query store
By Grant Fritchey

This is a book about the Query store that would “change the way you monitor performance … and the way you tune the performance..
Well, not so. This isn’t a book at all; this is merely a blogpost that has been put on paper.

For example, you have unreadable screendumps accompanied with the text :
“( you might have to click here to make it bigger)”

You will also see several pages of SQL code, for you to cut and paste – pardon, to type into management studio for an hour or so. Or search the web for the original post. The blogposts themselves are well written with clear questions and very verbose experiments, with an occasional reference to the source with a hyperlink. A hyperlink? Yes, a printed hyperlink.


Pages of Code to Type….

This book is not about the internals and the elaborate posts are to answer
questions such as:

What happens to Plan Forcing when you have RECOMPILE hint in your procs?
– Answer: nothing, a full recompile is done, that plan is discarded and the forced plan is used.

What happens with a forced plan when “Optimized for Ad Hoc” is configured?
– Answer: this may capture many plans, so change the capture behaviour from “All” to “automatic” . This will filter the input to the query store and avoid flooding the query store.

Which takes precedence, the Query Store force plan or a plan guide?
answer: Query Store

Interesting details, but more striking are the subjects that are missing from the book.

Overall verdict:
This printed blog with trivia about the query store will hardly speed up your research.
Keep your money and save the trees – in the case, a bonsai.

Tune SQL Server Like A Boss! – by Uwe Ricken

During the preconference of SQLSaturday Holland #666,  the MCM (Microsoft Certified Master) Uwe Ricken gave the day-long session “Analyze and Tune SQL Server Like A Boss!”. It’s a popular event that is often sold out, much to Uwe’s surprise. Performance seems to be an ever popular subject, attracting both newcomers and seasoned veterans of the field. I told him that it is often a passion-subject, and also open ended: you will never know if you’ll hear a new trick, unsupported traceflag or VMware setting that can help you in your troubleshooting quest. Also, we get access to his script repository, so we can peek over his shoulder and see what he sees.


Uwe explains traceflag 1117 with cups of water

His presentation style is amusing, concise and well paced.

Just to share one of his scripts, based on an idea of Glenn Berry, the CPU consumption of each database and the percentage:

USE master;
GO

SET TRANSACTION ISOLATION LEVEL READ UNCOMMITTED;
GO

WITH DB_CPU_Stats
AS
(
SELECT DatabaseID,
DB_NAME(DatabaseID) AS [Database Name],
SUM(total_worker_time) AS [CPU_Time_Ms]
FROM sys.dm_exec_query_stats AS qs
CROSS APPLY
(
SELECT CAST(value AS INT) AS [DatabaseID]
FROM sys.dm_exec_plan_attributes(qs.plan_handle)
WHERE attribute = N’dbid’
) AS F_DB
GROUP BY DatabaseID
)

SELECT ROW_NUMBER() OVER(ORDER BY [CPU_Time_Ms] DESC) AS [CPU Rank],
[Database Name], [CPU_Time_Ms],
CAST
(
[CPU_Time_Ms] * 1.0 / SUM([CPU_Time_Ms]) OVER() * 100.0
AS DECIMAL(5, 2)
) AS [CPU Percent]
FROM DB_CPU_Stats
WHERE DatabaseID <> 32767 — ResourceDB
ORDER BY
[CPU Rank] OPTION (RECOMPILE);
GO

SET TRANSACTION ISOLATION LEVEL READ COMMITTED;
GO


Tune a query from 5 hours to 10 seconds

The other day I had to tune a query that has gone awry when it was put on new hardware. The old runtime was around one hour, but on the newer hardware it had dropped to 5 hours and 20  minutes. The main reason i could think of was that the new hardware was placed at our new IAAS solution, and as usual the storage engineers had designed for availability, not performance. The CrystalMark numbers were half of that of our own old hardware.

Join me at this tunings demo (level 300 +) :

click for video

Review: The Warschau ‘Join Conference’

6 March 2017: It’s the second edition of the “Central Europe premium SQL Server conference” in downtown Warschau.  Located in the “Palace of Culture and Science” – affectionately known as a ‘Stalin Cake’, the conference has one of the best places to host a conference:

“Palace of Culture and Science” – as seen from my AirBnB room

With a touch of grandeur the familiar faces ( such as Kalen Delaney, Klaus Aschenbrenner, Uwe Ricken, Grant Fritchey and others ) were showing their gigs. Well organised, good food and a great venue made it a good experience. The only drawback of these sessions was that there wasn’t any session material posted on the website, nor any recordings. This is a pity, as demo’s are much fun to replay at home and to investigate them a bit deeper. I’m afraid I would prefer SQLSaturdays because of this omission.

Website at http://join-conference.com/


Xevents part 1: Analysing the System Health Session

Many DBA’s still rely on Profiler, despite the fact that Profile can track 200 events while Extended Events can have almost 900. The deprecated Profiler is not developed anymore and cannot cope with the new kids on the block, such as Availability Groups and Azure.

Time to show the power of Extended Events. In this first video, we’ll see how to group and filter events, check out the deadlock graphs, check for waitsstats during stressmoment. All from the default Extended Events trace, the System Health Session.

No configuration or programming yet – just the tour of functionalities.

 Click for Video