In order to harvest the SQL runtimes you may choose the tool that you are most comfortable with. I prefer Query Store, but Extended Events, Profiler and even a quick and dirty query on the DMV’s can be used. If you still have a version SQL2008 to maintain, I would recommend Open Query Store. This will give you Query Store functionality without having SQL2016. (Check out Open Query Store here).
Headstart scripts
I have a few scripts together with the Query Store datamodel stored here. The first script calculates the Total Execution Times per week, as this is the business cycle of the flower auction I currently work for. Adjust the interval to your needs. Business cycles are supposed to have about the same workload, so the TET numbers can be compared. The second script zooms in on this and shows all days of 2 business cycles (14 days). When I find that 2 days are different enough to examen them more closely, I create for each day the workload table with script 3. During this comparison, any SQL statement that comes out as interesting will be trendwatched with script 4.
Idea: Create a central repository
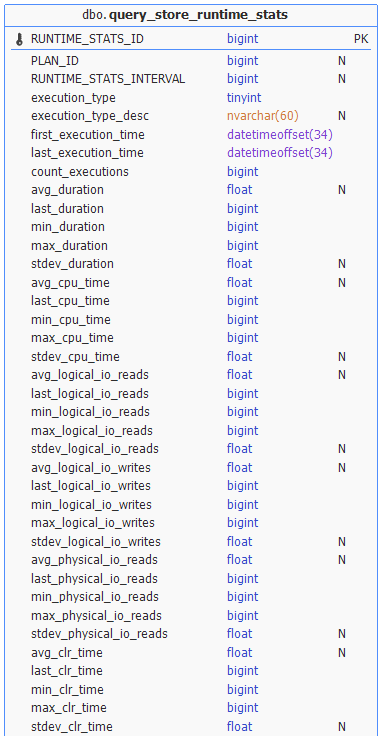
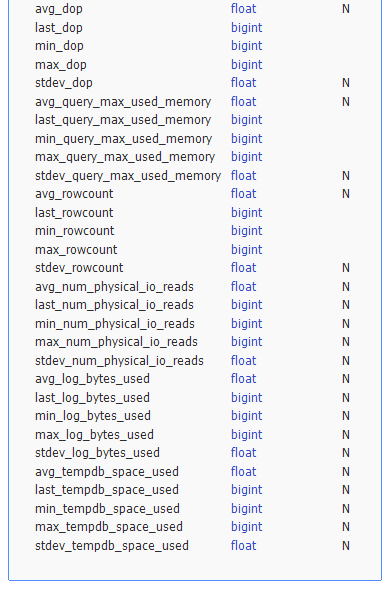
The Query Store repository can fill up quickly, so if you have several instances and databases to monitor you may consider to harvest a subset of the performance data and store this in a central repository. This way you can keep the retention period on the monitored databases small enough enough for incident analyses and use the central repository for trendanalysis. You need to choose the relevant data you want to harvest. Do you only want to harvest performance data, or do you also want resource consumption data? The datamodel of the Query Store comprises of 6 views. Largest view is the runtime_stats, where you can even query unusual data such as the standard deviation of the tempDB usage or the average DOP. Check out the views for diagnostic data you want to keep track of.